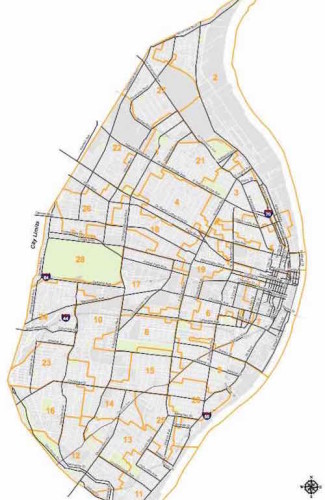
City of St. Louis: Presidential Primary By The Numbers
Last Tuesday was Missouri’s presidential preference primary.
More than 1.5 million Missourians voted in Tuesday’s presidential preference primary. That is up from about 1.4 million, the state’s previous record, set in 2008. Overall turnout hovered at 39 percent of registered voters, up from about 36 percent in 2008, the last time Republicans and Democrats had divided contests to decide.
Those trends were repeated in the St. Louis area, where turnout surged in St. Louis, St. Charles and Jefferson counties. St. Louis County turnout topped 45 percent, higher than the state average.
The trend did not hold in St. Louis, where turnout and ballots cast were slightly under the 2008 levels. (Post-Dispatch)
In the City of St. Louis, we know that Hillary Clinton & Donald Trump were the winners in their respective parties citywide. Is that it? After digging into the breakdown of the 28 wards, the election was more nuanced.
CITYWIDE
- Registered Voters: 181,167
- Ballots Cast: 76,729
- Turnout: 42.2%
- Percent Democrat/Republican: 81.8%/18%
- Democrat:
- Clinton 34,458 (55.01%)
- Sanders 27,748 (44.30%)
- Others
- Republican:
- Trump (36.35%)
- Cruz (32.41%)
- Kasich (18.49%)
- Others

WARDS (PDF map from City or Scribd)
Top 5 Most Democratic/Least Republican:
- 4th (99.1%)
- 22nd (98.9%)
- TIE: 1st & 27th (98.8%)
- 21st (98.2%)
Top 5 Most Republican/Least Democratic:
- 16th (42.4%)
- 12th (40.7%)
- 23rd (36.6%)
- 13th (30.4%)
- 24th (30.0%)
Top 5 Registered Voters
- 23rd 8,052
- 16th 7,974
- 27th 7,779
- 12th 7,360
- 21st 7,327
Bottom 5 Registered Voters:
- 20th 5,296
- 18th 5,324
- 25th 5,352
- 19th 5,380
- 5th 5,408
Top 5 Voter Turnout
- 8th (55.8%)
- 16th (54.0%)
- 28th (52.3%)
- 23rd (51.5%)
- 15th (48.4%)
Bottom 5 Voter Turnout
- 3rd (31.1%)
- 4th (31.3%)
- 1st (31.4%)
- 20th (32.2%)
- 22nd (32.4%)
CANDIDATES
Top 5 Wards won by Clinton — percentage
- 27th (76.31%)
- 21st (74.09%)
- 2nd (73.41%)
- 1st (73.18%)
- 22nd (72.64%)
Note: Clinton won 16 wards, Sanders won 12
Top 5 total votes for Clinton
- 27th (2,016)
- 21st (1,953)
- 6th (1,676)
- 28th (1,633)
- 26th (1,574)
Top 5 Wards won by Sanders — percentage
- 24th (65.04%)
- 15th (60.01%)
- 13th (59.67%)
- 8th (58.56%)
- 10th (58.02%)
Note: Sanders won 12 wards, Clinton won 16
Top 5 total votes for Sanders
- 8th (2,014)
- 15th (1,643)
- 24th (1,518)
- 23rd (1,485)
- 6th (1,333)
Top 5 Wards won by Trump — percentage
- 11th (51.47%)
- 20th (49.37%)
- 12th (43.74%)
- 10th (42.87%)
- 25th (42.37%)
Note: Trump won 13 wards, came in 2nd in 12, 3rd place in 3
Top 5 Wards won by Cruz — percentage
- 2nd (48.94%)
- 27th (48.39%)
- 1st (47.62%)
- TIE 4th & 21st (44.44%)
Note: Cruz won 13 wards, came in 2nd in 12, 3rd place in 3
Two Wards won by Kasich — percentage
- 28th (36.46%)
- 17th (29.12%)
Two wards where Ksasich placed 2nd — by percentage
- 19th (28.57%)
- 26th (26.74%)
Note: Kasich finished in 3rd in the remaining 14 wards.
You can download my spreadsheet to see the detail (Numbers | Excel), based on unofficial citywide & ward by ward results.
Graphic below made by others, click to view more:
No real surprises: Clinton won North City, Sanders won South city. Southwest City has the highest percentage of Republicans.
— Steve Patterson
And this reflects part of the problem with African American voters being marginalized – if you’re not part of the solution (showing up to vote), you’re part of the problem (not having your voices heard and issues addressed)!