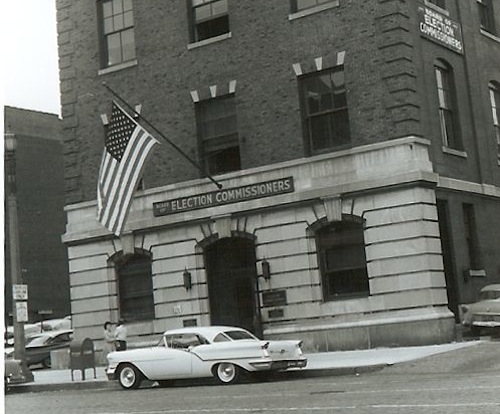
Most Won’t Vote Tomorrow
If you’re like me, you vote in every election. Unfortunately, not everyone is a regular voter.

With an open seat for mayor, the partisan primary last month had better turnout than 4 years earlier — though still dismal at just 28.6%. Last November the turnout was 69,43% — low compared to other areas in the region. Typically general elections get more voters than partisan primaries, many local governments are non-partisan so there is no primary,
St. Louis is backwards — the primary is the election. Yes, sometimes an independent will defeat an disliked Democratic nominee — Independent Scott Ogilvie defeating Democrat Tom Bauer in 2011.
Here is the voter turnout for the last decade, bold numbers are those less than 10%:
- 2007 March primary: 13.69%
- 2007 April general: 6.86%
- 2008 Presidential preference primary: 42.97%
- 2008 August primary: 18.20%
- 2008 November general: n/a
- 2009 March primary: 14.50%
- 2009 April general: 17.20%
- 2010 August primary: 18.58%
- 2010 November general: 48.52%
- 2011 March primary: n/a
- 2011 April general: 20.28%
- 2012 Presidential preference primary: 6.21%
- 2012 August primary : 26.77%
- 2012 November general: 74.04%
- 2013 March primary: 22.08%
- 2013 April general: 12.55%
- 2014 August primary: 20.29%
- 2014 November general: 34.05%
- 2015 March primary: 9.51%
- 2015 April general: 9.97%
- 2016 Presidential preference primary: 42.92%
- 2016 April propositions: 26.84%
- 2016 August primary: 28.26%
- 2016 November general: 69.43%
- 2017 March primary: 28.60%
- 2017 April general: ???
A few things stand out to me: elections to fill open seats attract more voters. Mayoral & presidential elections attract more voters than years without. In local municipal elections, the primary general has higher turnout than the election. Turnout in St. Louis is embarrassingly low.
— Steve Patterson