The poll this week is pretty straightforward — pick your two (2) favorite institutions in the Metropolitan Zoological Park and Museum District. Here are the five institutions, as listed on the ZMD website:
Saint Louis Art Museum The Saint Louis Art Museum is rated as one of the principal art museums in the United States and is visited by up to a half million persons every year. Click here for website
Saint Louis Zoological Park The Saint Louis Zoological Park is recognized as a leading zoo in animal management, research, conservation, and education. Admission is free, although there are fees for some activities. Click here for website
Missouri Botanical Garden The Missouri Botanical Garden is one of the oldest botanical institutions in the United States and a National Historic Landmark. Click here for website
Saint Louis Science Center The St. Louis Science Center is among the largest of its type and, like all science centers, is intended to be a place of informal science education for all ages. Click here for website
Missouri History Museum The Missouri Historical Society was established in 1866 to rescue “from oblivion the early history of the city and the state.” The Missouri History Museum houses a variety of exhibits and educational resources. Click here for website
Please vote in the poll located in the right sidebar, picking two of the provided answers. New poll 8am Sunday March 31st, results presented on Wednesday, April 3rd.
Plans were presented to the public last week to built a 7-mile modern streetcar line in St. Louis that would:
Circulate in the downtown central business district.
Head west on Olive/Lindell past Midtown to the Central West End.
A north-south segment would connect at 14th Street & Olive, initially going north Florissant Rd to St. Louis Ave. and south to the Civic Center MetroBus Center/MetroLink light rail.
Open in 2016/17.
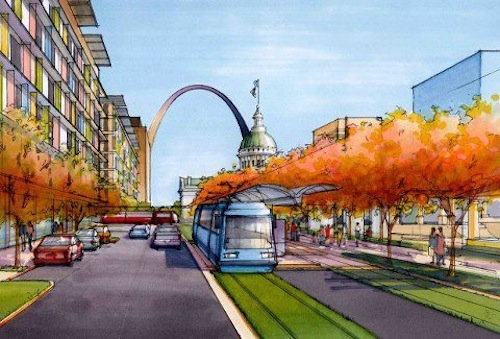
Artist rendering of streetcar in downtown St. Louis
Metro is part of the planning process and this would become part of our transit system. But I know some of you still question the effectiveness of the streetcar over the bus. To be fair, here is a skeptical view that I happen to agree with.
Streetcars that replace bus lines are not a mobility improvement. If you replace a bus with a streetcar on the same route, and make no other improvements, nobody will be able to get anywhere any faster than they could before. This makes streetcars quite different from most of the other transit investments being discussed today.
Where a streetcar is faster or more reliable than the bus route it replaced, this is because other improvements were made at the same time — improvements that could just as well have been made for the bus route. These improvements may have been politically packaged as part of the streetcar project, but they were logically independent, so their benefits are not really benefits of the streetcar as compared to the bus. (source – highly recommended)
He’s right that streetscape improvements are just as important as the mode of transit, but funding realities mean a complete makeover of 7 miles for a bus isn’t very likely. Even if it was, a streetcar is a better choice for other reasons:
Streetcar vs. Bus
Buses are excellent local and regional public transportation options, but they will do little to spur redevelopment and economic investment in Downtown LA. This is due to the inherent flexibility of bus service, as routes change regularly to accommodate varying needs; in addition, buses contribute to nerve-racking pedestrian experiences due to heavy street-level emissions and noise pollution that discourages active use of sidewalks. Streetcars do the exact opposite. They provide developers and business owners certainty that the routes will not change, and are considered preferable to buses by residents, visitors, and employees as they offer more amenities, highly reliable routes and timetables, and enhanced urban experiences.
Buses and streetcars do, however, work together to connect access points within regional transportation networks. For example, sidewalks can be designed to specifically accommodate both vehicle configurations; in return, a transit stop effectively doubles its value within a regional transportation network. (LA Streetcar)
And…
While it’s true that streetcars require a much larger initial capital investment than buses, that capital cost is offset by significant operational savings year to year. In the long term, streetcars are more affordable as long as they are used on high ridership routes.
Streetcars have higher passenger capacity than buses (even bendy ones), which means that if there are lots of riders on your route, you can move them with fewer vehicles. Fewer vehicles means more efficient use of fuel and fewer (unionized, pensioned) drivers to pay.
Streetcar vehicles themselves are much more sturdy than buses, and last many decades longer. While buses must generally be retired and replacements purchased about every 10 years, streetcars typically last 40 years or more. For example, Philadelphia’s SEPTA transit system is still using streetcar vehicles built in 1947. (Washington Post — recommended)
Even in Portland the value of streetcars have been debated, critics questioning claims of Mayor Hales:
So that brings us to the ruling. Hales said “streetcars carry more people than buses … you attract more riders who don’t ride transit now, and actually the operating costs are not any greater than the bus.” Whether these arguments make a persuasive case for the necessity and usefulness of a streetcar system is, of course, up for debate. The statement itself remains factual. While, there’s some missing context, it’s nothing significant. We rate this claim True. (PolitiFact Oregon)
For a detailed look at operating costs of streetcars vs bus click here. Labor tends to be a big factor why streetcars are cheaper to operate.
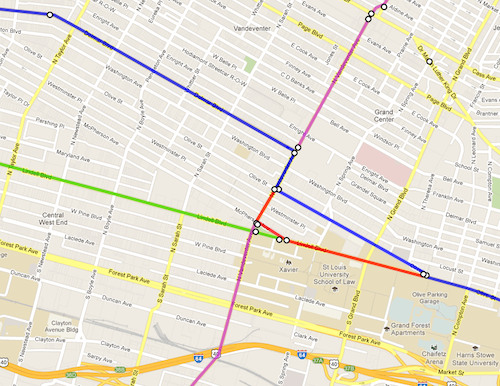
For the poll this week I want you to vote on your preferred route. I’ve included “don’t build” as an option as well as my idea of Olive to Vandeventer to Delmar: described here.
ABOVE: Blue was my original route idea, red is my variation, green is continuing on Lindell, purple is a north-south line on Vandeventer. Click image to view post. Note: This image added to this post at 10:30am on 3/10/2013.
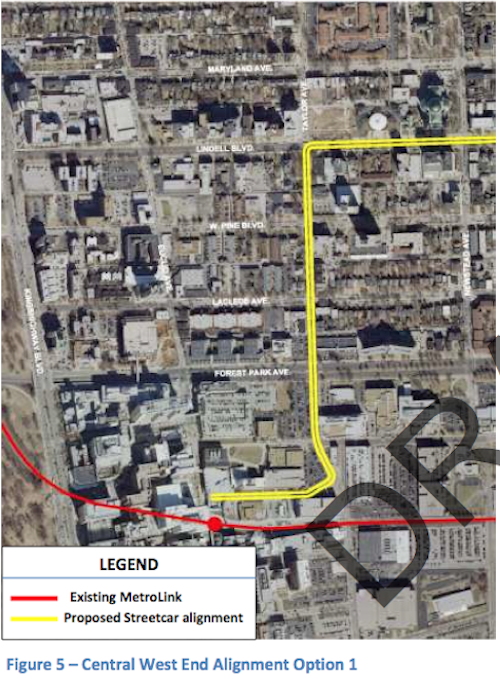
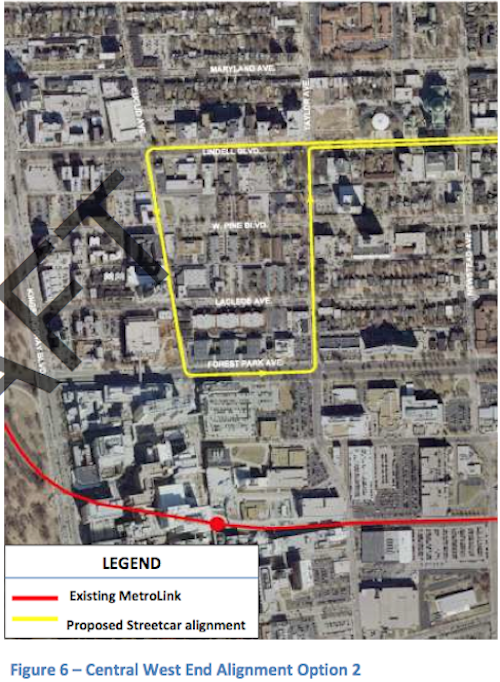
The poll also has the two options from the study (p17):
Option 1 includes double track on Taylor south to Children’s Place/CWE MetroLinkOption 2 continues to Euclid, to Forest Park Blvd to Taylor back to Lindell
My views on a St. Louis streetcar are evolving, more on Wednesday March 20. The poll is in the right sidebar (mobile users need to switch to the desktop layout)
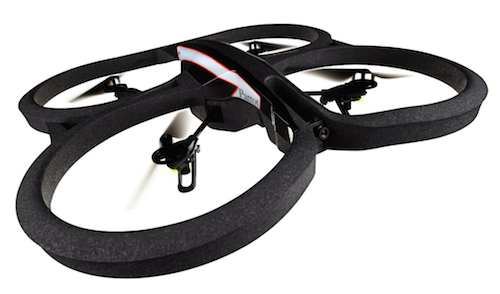
Personal mobility is a big part our lives, it often consumes a large percentage of our income. Over the 8+ years of this blog I’ve written about the many changes to my own transportation modes.
I had a car when I started, added a 49cc scooter after Katrina, got rid of the car in 2007, sold the scooter and bought a car in 2008 after my stroke, began using transit and then finally in April 2012 I sold my car.
I have one more change, my boyfriend and I have been living together for more than two weeks and his car makes me part of a one-car household. Many one-car couples I know both drive the car, just depending upon who needs it. In our household, for now at least, he’ll be the sole driver.
This new status prompted me to look into some demographics of car ownership.
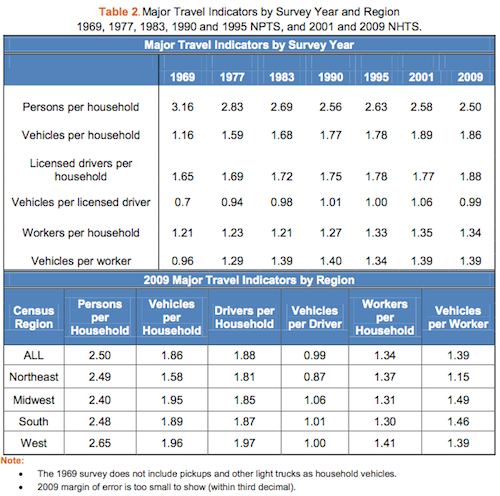
ABOVE: From the Summary of Travel Trends: 2009 National Household Travel Survey, click image to view PDF
Interesting how the number of vehicles per household has increased over four decades even as the number of persons per household has decreased. However, the number of licensed drivers per household has increased. No surprise seeing the highest auto ownership in the Midwest.
Dave’s not averse to using transit so there will be times we will go places on the bus.
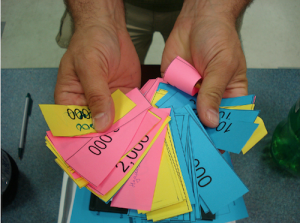
The idea of participatory budgeting has entered the local conversation. What is it? Glad you asked:
ABOVE: Participants are given slips to vote for various projects. Photo source: The Participatory Budgeting Project
The process was first developed in Brazil in 1989, and there are now over 1,500 participatory budgets around the world. Most of these are at the city level, for the municipal budget. PB has also been used, however, for counties, states, housing authorities, schools and school systems, universities, coalitions, and other public agencies.
Though each experience is different, most follow a similar basic process: residents brainstorm spending ideas, volunteer budget delegates develop proposals based on these ideas, residents vote on proposals, and the government implements the top projects. For example, if community members identify recreation spaces as a priority, their delegates might develop a proposal for basketball court renovations. The residents would then vote on this and other proposals, and if they approve the basketball court, the city pays to renovate it. (The Participatory Budgeting Project)
Sounds like a way to get more people to participate in decisions rather than just complain after the fact. But how would this work on a local aldermanic level? We just need to look to Chicago’s 49th ward and Ald Joe Moore:
Over the past three years, I’ve asked my constituents–the residents of the 49th Ward–to decide how to spend $1 million in tax dollars.
Each alderman in Chicago gets over $1 million a year to allocate for various infrastructure improvements in his or her ward. This so-called “menu money” goes to resurface streets and alleys, repair sidewalks and curbs and gutters, put in new streetlights, and the like. I’ve also used the money to subsidize special infrastructure projects, such as the Harold Washington Playlot and the Willye White Community Center. This menu money is spent at the total discretion of each alderman.
Beginning with the 2009-10 budget cycle, I have ceded my decision-making authority to the residents of my ward through a process known as Participatory Budgeting, or “PB49,” in which all 49th Ward residents are eligible to vote directly on the infrastructure projects that are funded in our community.
The 49th Ward is the first political jurisdiction in the nation to adopt such an approach to public spending, and it’s been so well-received that I have pledged to make it a permanent fixture in the ward. Word of our success has spread. This year, three other Chicago aldermen have pledged to use participatory budgeting to decide how to spend their aldermanic menu money and other cities in the U.S., including New York City and Vallejo, California, are emulating our model. (source)
St. Louis, like Chicago, has funds available for each ward. These funds get allocated and spent each year with little to no input from the public. In some cases the money isn’t spent, the alderman decides to hoard the funds instead.
So what do you think, do you support this idea in St. Louis? The poll is in the right sidebar.
AARP Livibility Index
The Livability Index scores neighborhoods and communities across the U.S. for the services and amenities that impact your life the most
Built St. Louis
historic architecture of St. Louis, Missouri – mourning the losses, celebrating the survivors.
Geo St. Louis
a guide to geospatial data about the City of St. Louis
 The poll this week is pretty straightforward — pick your two (2) favorite institutions in the Metropolitan Zoological Park and Museum District. Here are the five institutions, as listed on the ZMD website: