Home » Sunday Poll » Recent Articles:

Readers Split on Giving the Chronically Homeless Apartments

February 26, 2014 Featured, Homeless, Sunday Poll 7 Comments

My views towards homelessness have changed over the years; I wasn’t a supporter of the “housing first” model, it didn’t make sense to me. Now, after looking into it with an open mind, I see it is very logical. We know from decades of experience that how we’ve been attempting to address the issue of chronic homelessness hasn’t worked, requiring the chronic homeless to jump through hoops doesn’t work. and is costly and detrimental to the community at large. A different approach is needed.

Enter the housing first approach advocated nationally by  100,000 Homes. Their manifesto has four elements:

Housing First:

For years, homeless service providers worked to offer medical and mental health care, addiction counseling, job training and countless other services to people living on the streets. Most homeless people were told they had to earn their way to permanent housing by checking these supplementary boxes.

While the intentions behind this approach were good, the unfortunate result was that very few people ever escaped the streets.

100,000 Homes communities believe this traditional approach is backwards, and the data agrees with them. Countless studies have now shown that we must offer housing first, not last, if we want to help people out of homelessness. An immediate connection to permanent supportive housing can ensure that over 80% of homeless individuals remain housed, even among clients with severe substance abuse and mental health conditions. (read more)

Know Who’s Out There:

Person-specific data is the key to ending homelessness for our most vulnerable (and often anonymous) homeless neighbors.

100,000 Homes communities identify their homeless neighbors by name through an event called a Registry Week, the organizing backbone of the 100,000 Homes Campaign. The Registry Week process is based on a simple idea: communities should work to identify their most vulnerable or at-risk homeless residents and prioritize them for permanent housing. Medical research published in highly regarded, peer-reviewed journals highlights several health and social conditions that make people more likely to die on the streets. We’ve created a survey tool, the Vulnerability Index, that screens for those conditions and helps communities identify the most vulnerable people in their midst.

After an extensive volunteer training, Registry Week volunteers comb the streets of their communities block by block to ask as many people as possible to complete the Vulnerability Index questionnaire. This process occurs early in the morning, usually between the hours of 4 and 7 a.m. to ensure that those surveyed are among the unsheltered homeless population. Unsheltered individuals and families tend to reflect those who are not seeking or engaging with local service systems independently, and thus, those who are most likely to remain unhoused without proactive assistance. (read more)

Track Your Progress:

Solving a problem is impossible without a broad-based team and a reliable way of measuring success. Without regular performance data, we have no way of knowing whether or not the methods that communities are employing to end homelessness are working. That’s why 100,000 Homes communities commit to reporting their housing progress monthly and measuring that performance against clear and carefully determined benchmarks.

Each month, local advocates report the total number of people they have housed to the 100,000 Homes data team which uses that information to prepare detailed, individually tailored performance reports for each community enrolled in the Campaign. These reports outline a community’s progress toward its goal of ending homelessness and compare its efforts to the performance of similarly sized and resourced communities around the country.

When communities report consistently for three months in a row, they are placed on the 100,000 Homes Fully Committed List, a list regularly shared with national funders and media representatives in an effort to highly communities who are committed to using data to improve performance. (read more)

Improve Local Systems:

In most cases, the solution to homelessness is apparent– it’s implementing that solution that often proves challenging. This is because most communities have no clear, intentionally developed process for moving homeless people from the streets to permanent housing quickly and efficiently. Typically, different local agencies and organizations own different pieces of the housing process and rarely communicate with one another. These various groups require redundant forms, applications, and interview steps and often fail to process these requirements in a regular or timely way. As a result, it often takes more than a year to move a single individual from homelessness to a home, even with sustainable funding in place.

100,000 Homes communities are committed to pulling together their multiple overlapping service systems into a single, well-oiled housing placement machine capable of moving homeless individuals into permanent housing in as little time as possible. By applying process improvement techniques drawn from industry and the private sector to local housing and human service work, many communities have been able to dramatically reduce the amount of time required to house a single homeless person by as much as 80 percent. (read more)

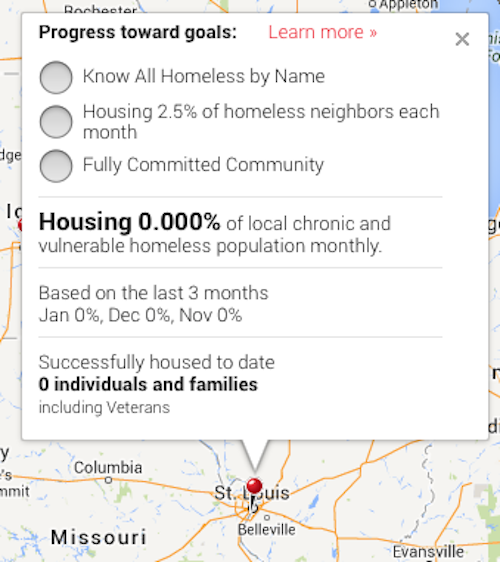
St. Louis is listed as a community on the organization website but clicking on the dot on the map is disappointing:

Zero progress?
Zero progress?

I emailed St. Louis’ director of human services William Siedhoff who replied;

“St. Louis might be listed as a community as part of the 100k effort but we have never been a participant in this program and, to my knowledge, none of the surrounding counties are involved either. Therefore, there would be no reporting of data on people being housed in the St. Louis region to this program.”

That’s good to know. Siedhoff also sent me a link to an article from a few days ago:

TAMPA — In 2002, local leaders adopted a 10-year plan to end homelessness in Hillsborough County based on the “housing first” philosophy sweeping the nation. In 2005, the city of St. Louis adopted a similar plan.

Nine years later, St. Louis’ plan has lowered its homeless population by more than 30 percent.

Hillsborough’s plan was never carried out. (read more — highly recommended)

Some in Tampa want to emulate our model.

The poll question last week was on homelessness, here are the results:

Q: Do you support giving the chronically homeless apartments?

  1. Yes, it’s likely cheaper 36 [29.27%]
  2. Yes, but only after completing work/treatment programs 30 [24.39%]
  3. Maybe, I need to learn more 29 [23.58%]
  4. No, they need to work like the rest of society 24 [19.51%]
  5. Unsure/No Opinion 4 [3.25%]

The 24 who said no are probably the same ones who complain the loudest about the homeless, lots of talk but no actual solutions. Likewise the 30 who said only after completing programs need to understand how housing improves the success rate. Without housing social workers have less success helping these individuals.

The government and public are spending billions annually already, the question is how effective are we?  There’s evidence to support the idea that getting the chronic homeless off the streets first lessons the burden on the community and has a greater chance of helping the individuals long term.

— Steve Patterson


Poll: Should the President of the Board of Aldermen be selected from within the BoA or continue as a citywide office?

Please vote in the poll, located in the right sidebar

A recent article caught my eye because of the suggestion of a major change in governance in St. Louis government:

For decades, the politicians in City Hall’s marble-columned aldermanic chamber have jostled and jockeyed for power.

Now, as they gather this morning to celebrate the city’s 250th birthday, some are contemplating changes that would fundamentally recast the municipal makeup.

One of those would hand the aldermen more power by having them choose the president of the Board of Aldermen, an office that has long been elected by a citywide popular vote.

No bill has been written or introduced, but the possibility is filled with intrigue because St. Louis’ system of government vests considerable power in the board president’s office — and Mayor Francis Slay’s chief electoral opponent from last year, Lewis Reed, holds its gavel. (stltoday)

This isn’t about Slay & Reed though, it’s about the city’s charter — it’ll be 100 years old in June.

Most legislative bodies elect their leader from within their ranks. St. Louis County Council, for example, has 7 members. They elect a chairman from within. District 2 Councilman Kathleen Kelly Burkett is currently Chairman, current Councilmen Hazel Erby (Dist 1) & Greg Quinn (Dist 7) have both served as Chairman of the council. Would any of these three be able to win a countywide election to be chairman?  Probably not.  But being a good leader and being able to win a wide popular vote are two separate issues.

Either citizens 100 years ago got it right, or wrong, by having our legislative leader elected citywide. In 8 years the number of wards in the city will be cut in half — from 28 to 14. I think it’s worth considering having the leader of the Board of Aldermen not be elected citywide, but chosen from within among the 14. So this is the topic of the poll question this week, you can vote in the right sidebar.

— Steve Patterson


Readers Not Among The Unbanked

February 19, 2014 Economy, Sunday Poll 2 Comments

The number of unbanked citizens in St. Louis is high, but according to the unscientific poll last week readers of this blog aren’t among them:

Q: Not everyone uses all available financial tools, which of the following do you use? (check all that apply)

  1. Debit card(s) 56 [14.58%]
  2. Retirement account through employer 43 [11.2%]
  3. Credit card(s) paid each month 43 [11.2%]
  4. Checking account at brick & mortar bank 42 [10.94%]
  5. Investment portfolio 39 [10.16%]
  6. Checking account online 38 [9.9%]
  7. Savings account online 35 [9.11%]
  8. Savings account at brick & mortar bank 28 [7.29%]
  9. Savings account at brick & mortar credit union 20 [5.21%]
  10. Credit card(s) with a balance each month 20 [5.21%]
  11. Checking account at brick & mortar credit union 18 [4.69%]
  12. Other: 2 [0.52%]
    • dwolla (for online payments)
    • checking with interest at credit union
  13. None: no checking, savings, debit, credit, portfolio 0 [0%]

I was a little surprised to see online checking/saving ranked higher than credit unions. However, we just recently opened an online savings account separate from our credit union checking & savings accounts, it’s very user friendly. We both had bank accounts for years but a few years ago I switched to a credit union. I never ordered physical checks since bills can be paid online, with debit card, or via bill pay online. I never liked paper checks — all that processing:

On a normal day, about $6 billion was literally up in the air as checks flew to their destination. That amount grew to $47 billion after the FAA grounded planes in the wake of the 9/11 terrorist attacks.

That spurred passage of the Check 21 Act, which allowed banks to use electronic images of checks instead of paper. (Business Insider)

But to the unbanked out there financial life isn’t as easy.  Apparently many have their income, often social security, sent to check cashing places. They go in monthly to get their money in cash, less enormous fees. Then they end up buying money orders to pay bills. Meager incomes made even worse by the costs of being unbanked.  Prior experience with bank overdraft fees and closed bank accounts have left many thinking cash is their only option. Businesses like check cashing places, tax refund lenders, title lenders, etc prey on the less financially literate in our community.

Here’s more on who is unbanked:

Among common demographics (income, education, age, race and family structure), several vulnerable groups emerged:

  • Households with incomes less than $15,000 were unbanked at a rate of 31.4 percent.
  • African-Americans were unbanked at a rate of 26.5 percent.
  • Households headed by single mothers had unbanked rates of approximately 23.5 percent.
  • Individuals with no high school degree lacked transactions accounts at a rate of 24.5 percent.

A comparison of the at-risk groups with the District average (9.5 percent) is stark: They were two to three times more likely to be unbanked. (Federal Reserve of St. Louis

This problem is a community problem. I don’t know the solution for reducing the number of unbanked in St. Louis, but organizations like Justin PETERSEN are working on the problem.

— Steve Patterson


Poll: Do You Support Giving the Chronically Homeless Apartments?

A week ago 60 Minutes did an interesting story on the homeless:

Please vote in the poll, located in the right sidebar

Giving apartments to homeless people who’ve been on the streets for years before they’ve received treatment for drug or alcohol problems or mental illness may not sound like a wise idea. But that’s what’s being done in cities across America in an approach that targets those who’ve been homeless the longest and are believed to be at greatest risk of dying, especially with all of this cold weather.

They’re people who once might have been viewed as unreachable. But cities and counties affiliated with a movement known as the 100,000 Homes Campaign have so far managed to get 80,000 of them off the streets. Local governments and non-profit groups do most of the work. The money comes mostly from existing federal programs and private donations, and there’s evidence that this approach saves taxpayers money. (100,000 Homes: Housing the homeless saves money?)

Related stories:

St. Louis has been setting up apartments for the chronically homeless for a while for a while now, I’ve been a skeptic but I’m slowly seeing the value. I’ll share more thoughts on Wednesday February 26th when I post the results from this week’s poll. Please vote in the right sidebar.

— Steve Patterson


Poll: Which Financial Tools Do You Use?

February 9, 2014 Economy, Featured, Sunday Poll 9 Comments

I’m learning more and more about the “unbanked” and “underbanked” citizens in our community. From September 2012:

The percentage of households in the St. Louis region that are ‘unbanked’ rose to an estimated 9.7 percent in 2011, according to a survey released by the Federal Deposit Insurance Corp. Wednesday, an increase from 7.6 percent in 2009, when the survey was last conducted.

The percentage of unbanked African-American households soared to 29 percent locally, among the highest rates in the nation, though down slightly from the last survey.

Nationally, 8.2 percent of U.S. households, or about 10 million, are unbanked, an increase of about 821,000 households since 2009. (stltoday)

A year ago a local effort was made to spread good financial literacy:

Financial institutions, community based organizations, social service and faith based agencies, community leaders, local and state officials, advocacy groups and grassroots members formed to create the St. Louis Regional Unbanked Task Force. The Task Force’s mission is to identify and address systemic and individual barriers that prohibit unbanked and under-banked households from utilizing traditional banking products and services. The Task Force is using data from sources such as the FDIC, Neighborhood Data Gateway, and data collected by individual member banks in a variety of ways: to understand and educate people about the need, to help set goals for the number of unbanked households who will open and maintain new accounts, to target marketing and outreach initiatives, and to measure their progress. The Task Force’s first major initiative, driven by data about the specific needs of the unbanked and underbanked in the St. Louis region, will be BANK-On SAVE-Up, which is launching February 21, 2013. (source)

The Bank On Save Up St. Louis program

Which brings me to the poll this week:

Q: Not everyone uses all available financial tools, which of the following do you use? (check all that apply):

  • Checking account at brick & mortar bank
  • Checking account at brick & mortar credit union
  • Checking account online
  • Savings account at brick & mortar bank
  • Savings account at brick & mortar credit union
  • Savings account online
  • Investment portfolio
  • Retirement account through employer
  • Credit card(s) paid each month
  • Credit card(s) with a balance each month
  • Debit card(s)
  • None: no checking, savings, debit, credit, portfolio

The poll is in the right sidebar, the answers will be presented in random order.

b


Advertisement


[custom-facebook-feed]

Archives

Categories

Advertisement


Subscribe