Home » Sunday Poll » Recent Articles:

Poll Results on Vehicles Per Licensed Driver

There are many ways to measure and compare regions/states on how auto-centric they are. For the poll last week I selected number of vehicles per licensed driver. The results of the poll are near the end but first I want to share other data.

Ford Focus at the 2011 St. Louis Auto Show

Examples of vehicle miles traveled per capita in 2005:

  • 1) New York City metro: 5,889.9
  • 11) Chicago metro: 7,540.5
  • 22) Seattle metro: 8,552.6
  • 37) Wichita: 9,237.2
  • 46) Minneapolis metro: 9,585.0
  • 55) Austin metro: 10,220.3
  • 64) Kansas City metro: 10,726.2
  • 77) St. Louis metro: 11,511.4 
  • 88) Nashville metro: 12,275.4
  • 92) Oklahoma City metro: 12,325.0

I see this as good evidence our region is too auto dependent, 76 metro areas had less vehicles miles per person than we did in 2005! But maybe we’ve peaked:

When adjusted for population growth, the number of miles driven in the United States peaked in 2005 and dropped steadily thereafter, according to an analysis by Doug Short of Advisor Perspectives, an investment research company. As of April 2013, the number of miles driven per person was nearly 9 percent below the peak and equal to where the country was in January 1995. Part of the explanation certainly lies in the recession, because cash-strapped Americans could not afford new cars, and the unemployed weren’t going to work anyway. But by many measures the decrease in driving preceded the downturn and appears to be persisting now that recovery is under way. The next few years will be telling. (New York Times)

Even if we’ve declined since 2005 like everyone else, we’re still driving considerably more miles per capita than 76 other regions.

Here are the results from last week’s poll:

Q: How many vehicles per licensed driver in your household?

  1. One+, but less than two 33 [45.21%]
  2. Less than one, more than zero 21 [28.77%]
  3. Two+, but less than three 9 [12.33%]
  4. Zero 6 [8.22%]
  5. Three+ 4 [5.48%]

I’ll admit I broke an important rule when it comes to polls — keeping the answers uniform. It appears the readers who responded don’t have an excess of vehicles, with over 8% saying their household has zero cars per licensed driver.

— Steve Patterson
 

Poll: Have you, a family member, or friends, experienced at least a month of “Food Insecurity” in the last 5 years?

Food security/insecurity may be terms you’re not familiar with, this may help:

Food security refers to the availability of food and one’s access to it. A household is considered food-secure when its occupants do not live in hunger or fear of starvation. The USDA estimates that nearly 9 out of 10 U.S households were food secure throughout 2005. It is a measure of resilience to future disruption or unavailability of critical food supply due to various risk factors including droughts, shipping disruptions, fuel shortages, economic instability, wars, etc. Food security assessment is divided into the self-sufficiency rate (S) and external dependency rate (1-S) as this divides the largest set of risk factors. Although countries may desire a high self-sufficiency rate to avoid transport risks, this may be difficult to achieve especially for wealthy countries, generally due to higher regional production costs. Conversely, high self-sufficiency without economic means leaves countries vulnerable to production risks.

The World Health Organization defines three facets of food security: food availability, food access, and food use. Food availability is having available sufficient quantities of food on a consistent basis. Food access is having sufficient resources, both economic and physical, to obtain appropriate foods for a nutritious diet. Food use is the appropriate use based on knowledge of basic nutrition and care, as well as adequate water and sanitation. The FAO adds a fourth facet: the stability of the first three dimensions of food security over time. (Wikipedia)

Congress is currently debating cuts to the nation’s food stamp program — properly known as the Supplemental Nutrition Assistance Program (SNAP):

SNAP offers nutrition assistance to millions of eligible, low-income individuals and families and provides economic benefits to communities. SNAP is the largest program in the domestic hunger safety net. The Food and Nutrition Service works with State agencies, nutrition educators, and neighborhood and faith-based organizations to ensure that those eligible for nutrition assistance can make informed decisions about applying for the program and can access benefits. FNS also works with State partners and the retail community to improve program administration and ensure program integrity.

The poll this week asks if you, your family, or your friends, have had at least a month of food insecurity in the last 5 years. I’ll share my personal views on the topic, and share my own food insecurity experience, with the poll results on Wednesday, October 9th. The poll is in the right sidebar.

— Steve Patterson


Poll: How Many Vehicles Per Licensed Driver In Your Household?

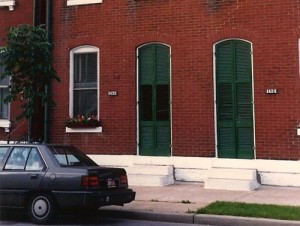
In the early 90s I lived in Old North and drove a late 80s Mitsubishi
In the early 90s I lived in a 3-room flat on Sullivan and drove a late 80s Mitsubishi

It has been nearly a year and a half since I sold my last car. In that time I’ve managed fine without a car, except for 2 times this year when I rented a vehicle to go out of town. Not having a car has got me thinking about cars I have owned over the 30 years I’ve been driving.

Growing up in suburban Oklahoma City our driveway could hold nine vehicles, with two more in the garage. Pretty consistently we had more than one vehicle per licensed driver.   Yes, not a typo — our driveway was 3×3.

I once owned three Volvos at one time, later I owned two Saabs concurrently. Now I don’t have a car, but my boyfriend does. Years ago my personal household had a peak of three vehicles per licensed driver, but now it is 0.5 vehicles per licensed driver. But for the most of the last 25 years on my own I’ve been one driver with one car.

For the poll question the week I’d like to know about the number of vehicles per licensed driver in your current household. The poll is in the right sidebar, I’ll post the results on Wednesday October 2nd.

— Steve Patterson


Poll: Which two of the four Bus Rapid Transit (BRT) routes would you like to see planners seek federal funding

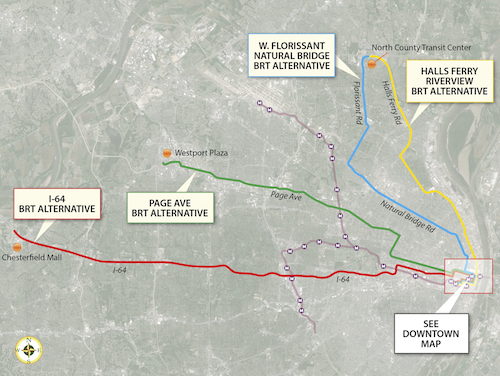
Last week regional transportation planners presented four Bus Rapid Transit (BRT) being considered. Soon two will be picked to submit for federal funding.

Four alternative BRT routes, click image to view larger version

I attended the presentation at City Hall and participated in the audience voting using hand held devices. They asked a couple of questions to help them in their decision. To keep things simple I’m just asking which two of the four BRT routes should move forward with a request for federal funding.

From MovingTransitForward.org:

These four potential BRT routes are options for improving transit connections between St. Louis County and the City of St. Louis. One of the study’s main goals is to address the need for quick, direct travel from neighborhoods north and south of Downtown St. Louis to employers located in north and west St. Louis County. The “Central Corridor” stretching from Downtown St. Louis to the Central West End and Clayton still holds the region’s largest concentration of jobs, but the largest job growth is occurring in places like Chesterfield, Earth City, and St. Charles – areas easily accessible by highway, but currently not by public transit. The type of BRT service currently being studied is intended to expand access and improve travel time to those job opportunities – of particular importance to reverse commuters traveling to major job centers in suburban areas – while also providing a premium transit alternative for car commuters. The Rapid Transit Connector Study will identify candidates for Metro’s first two BRT routes; Metro will continue to work with the region to identify future BRT routes. Other transit options identified in Moving Transit Forward, such as expansions of the MetroLink System, are intended to meet other long-term goals such as strengthening neighborhoods and encouraging transit-oriented development.
Alternatives analysis involves evaluating the performance of each alternative along parameters including ridership, expanded access to key destinations, travel time savings, and land use benefits. These technical outcomes will be combined with public input to identify the two potential projects most likely to meet project goals, benefit the region, and successfully compete for federal funding.

One final meeting will be held this Tuesday:

September 17, 2013
5:30-7:30 p.m., open house with presentation at 6:30 p.m.
Chesterfield City Hall, Council Chambers
690 Chesterfield Pkwy W.
Chesterfield, MO 63017

The downtown inset can be viewed here.

You may not like any of the four, however, I’ve not allowed any custom answers so you can’t suggest any other routes. These four need to be narrowed to two. I did provide “none” as an option as well as “unsure/no answer.” The poll is in the right sidebar (desktop layout).

— Steve Patterson


Poll: Should St. Louis City & St. Louis County Reconcile? If So, How?

Please vote in the poll, located in the right sidebar

For decades now there have been efforts to nullify the “Great Divorce of 1876“, when the City of St. Louis removed itself from St. Louis County, becoming an independent city with municipal & county offices. All have failed.

Past failure, however, doesn’t deter some from pushing the idea again. An editorial from last month: Time to go public on mediation talks for the Great Reconciliation. A perfect subject for a poll.

Here are the  options, in order from no change to big change:

  1. St. Louis City & St. Louis County should remain completely separate (no change)
  2. St. Louis City & St. Louis County should remain separate, but partner more
  3. St. Louis City should rejoin St. Louis County as the 91st municipally
  4. St. Louis City & St. Louis County (and all its municipalities) should become one government body
  5. St. Louis City & St. Louis County (and all its municipalities, schools districts, fire districts, etc) should become one government body

The answers will be presented in random order in the poll, located in the right sidebar. Interestingly, any change would require a statewide vote since the state constitution would need to be amended.

— Steve Patterson


Advertisement


[custom-facebook-feed]

Archives

Categories

Advertisement


Subscribe