Home » Transportation » Recent Articles:

Transportation Investment Key To Redeveloping The North Riverfront Area

January 22, 2018 Featured, North City, Public Transit, Transportation Comments Off on Transportation Investment Key To Redeveloping The North Riverfront Area

St. Louis tried redeveloping the North Riverfront, the largely vacant area just North of Laclede’s Landing, by razing it and building an NFL stadium. That failed…thankfully. Next up, the area was included in our bid to win Amazon’s HQ2. Last week Amazon announced their list of 20 cities being considered — St. Louis’ bid didn’t make the cut.

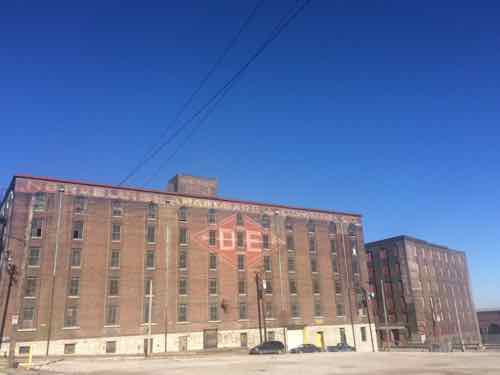
Warehouses along Ashley between 2nd and Lewis.

So now what to do with the North Riverfront? I say stop dreaming about a magic pill that’ll do it in one shot. The street grid still exists, sidewalks need to be built. There’s lots of room foe new buildings and existing buildings awaiting new uses. St. Louis could invest in the area and enact a form-based code to guide future development. The investment would take the form of infrastructure — utilities, sidewalks, and transportation.

St. Louis is working on a North-South light rail plan to the West. This new line will use low-floor vehicles, not the high-floor vehicles used on our current MetroLink light rail lines. Modern streetcar & light rail lines use the same vehicles, the light rail usually just being longer and on a track where higher speeds are available. What does this have to do with the North Riverfront area?

We can use the same vehicles, maintenance facility, etc to operate lower-speed circulation streetcar route that’s connected to the proposed North-South line,

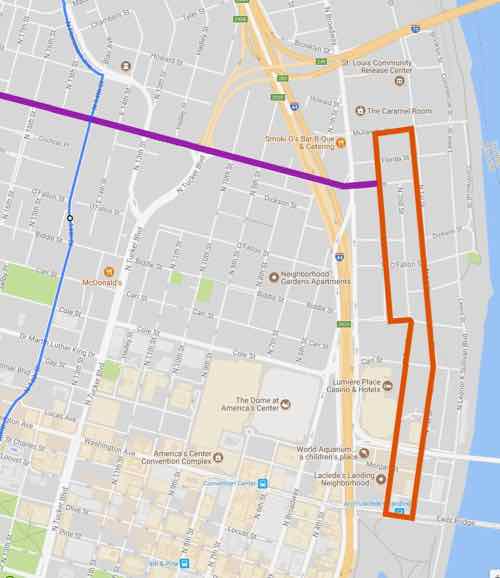
The blue line rep[resents the proposed North-South LR, the orange is a circulator route going from the Eads Bridge MetroLink station up to Mullanphy St. The purple is a connecting route along Cass — which could extend to the new NGA HQ and perhaps beyond in future expansions. After uploading the graphic I realized it would be good to have a connection in the center of the orange circulator route — at Biddle.
The orange line is just under 2 miles long. Yes, I know, a bus is a far cheaper way to move people. I also know a bus route doesn’t spur private development. This have the potential to connect The Arch, Laclede’s Landing, the upcoming North-South line, and the NGA HQ.

— Steve Patterson


Opinion: St. Louis Expects Lots of Lanes Because of Harland Bartholomew

October 11, 2017 Featured, Planning & Design, Transportation Comments Off on Opinion: St. Louis Expects Lots of Lanes Because of Harland Bartholomew

Before the automobile public right-of-ways (PROW), public-owned land that connects private property, was shared by pedestrians, people on horseback, horse-drawn carriages, trollies pulled by horses, etc.  PROW in cities were becoming increasingly crowded. Many roads were unpaved, those that were in cobblestones. Waste from horses & mules made the PROW filthy.

The new automobile made the PROW even more crowded. More than a century ago, a civil engineer in his late 20s arrived in St. Louis.

Harland Bartholomew (September 14, 1889 – December 2, 1989) was an American urban planner. Although a civil engineer by training and disposition, Harland’s career started just as the automobile production was about to take off, industrial development was booming and urban populations grew. The novel challenges and opportunities brought about by this new form of transport inspired the invention of new community concepts and required the development of new approaches to planning transportation in cities. These challenges called for the skills of an engineer to analyze transportation needs quantitiatively as well as those of a person passionate about urban design and social conditions. Harland was able to deliver these qualities. Starting in 1911 and continuing until 1930 Harland Bartholomew created new methodologies and new designs and concepts which made contributions that remain relevant to urban planning in North America today. This novel approach became known as comprehensive planning. His skills and experience were sought by many city planning commissions. Ultimately cities would develop their own in house technical staff to carry on with planning issues. Harland himself was the first full-time planner employed by an American city, and he remained a planner with St. Louis, Missouri for 37 years. During this period both the city of St. Louis and its surrounding areas were thriving and growing. Due to his groundbreaking work he can be described as the father of American and Canadian city planning in the age of the automobile. (Wikipedia)

Bartholomew, like his better-known contemporary, NYC’s Robert Moses, believed it was necessary to destroy the city to save it from itself. Everything prior to the 20th century was wrong for the modern world of the automobile.

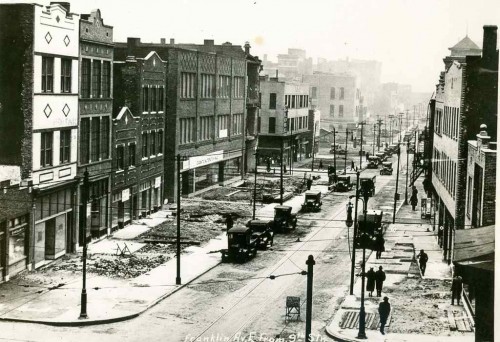
Franklin Ave looking East from 9th, 1928. Nothing in this image remains. Collection of the Landmarks Association of St Louis

This make room for the automobile view is clear in Bartholomew’s 1947 plan, from the streets & trafficways section:

Since 1916 St. Louis has expended over $40,000,000 in opening, widening, connecting, and extending the system of major streets. Much has been accomplished in converting a horse and buggy street system to automobile needs. As the total volume of traffic increases, however, certain new needs arise. An example is the desirability of grade separations at extremely heavy intersections, such as at Grand and Market and at Kingshighway and Lindell. Likewise there is a need for complete separation of grade where traffic volume is sufficiently heavy to justify the cost involved. The Federal Government, which has helped finance our splendid system of national highways, has recently revised its policies and Congress has appropriated substantial funds to aid the cities in the construction of express highways and for facilitation of traffic flows from certain selected state highways through metropolitan areas to the central business districts of large cities. Past and present experience reveals the need for four types of major streets and trafficways as follows:

  1. Secondary Streets (4 Lanes)
    Most St. Louis streets were laid out with a width of 60 feet. A considerable volume of traffic can be accommodated in a 60-foot street with a 40-foot roadway, especially if curb parking is restricted at times of heavy traffic flow. Such streets as Nebraska, Compton, and Goodfellow can pr6bably continue for many years to accommodate a considerable volume of traffic flow without widening. All local residential areas require access and must be served either by wide major streets or by these secondary streets which thereby become important integral parts of the major street plan.
  2. Major Streets (6 Lanes)
    Grand Avenue, Chippewa Street, and Easton Avenue are examples of important cross-town routes which accommo date a considerable volume of traffic including mass trans portation facilities (i.e., streetcars or buses). Their general width of 80 feet permits a 54 or 56 foot roadway to accom modate six lanes of traffic. There is need for quite a number of such routes where traffic volume is insufficient to warrantgreater width of the street except by expensive widening of the street.
  3. Major Streets (8 Lanes)
    These are the main traffic ways, as for example Gravois Avenue, Market Street, Natural Bridge Road, Lindell Boulevard and Kingshighway. They are the dominant structural elements of the street plan. Their traffic capacity is unusually high since they permit three or four lanes of moving traffic in each direction. It is impractical to provide for streets with wider roadways because of weaving and complications encountered in traffic control.
  4. Express Highways
    When traffic volume becomes so great that it cannot be accommodated even on eight lane surface highways it becomes necessary to provide for uninterrupted traffic flows through grade separations in the form of depressed roadways in wide right-of-ways or by roadway elevation. An overall right-of-way width of 200 feet is generally considered a minimum standard. This is far more costly than street widening but a limited mileage can be justified where there is sufficient traffic volume.

In today’s money that’s nearby a billion dollars! I’m uncertain if any city carried out the costly widening of the PROW the way St. Louis did. Based solely on my personal observations in other cities, I’d say St. Louis was the most aggressive. It’s no wonder that more than a quarter of those of voted in the recent non-scientific Sunday Poll have a problem with road diets.

Q: Agree or disagree: ‘Road Diet’ projects slow traffic too much, cause congestion; should be reversed.

  • Strongly agree 7 [18.42%]
  • Agree 0 [0%]
  • Somewhat agree 3 [7.89%]
  • Neither agree or disagree 3 [7.89%]
  • Somewhat disagree 1 [2.63%]
  • Disagree 8 [21.05%]
  • Strongly disagree 14 [36.84%]
  • Unsure/No Answer 2 [5.26%]

Sadly, our road diets have been designed to appease critics, so sidewalks new still too narrow — barely wide enough for existing for traffic.  Motorists usually drive on typically wide Set. Louis area streets then encounter the “Great Streets” section for a brief period before returning to the more common Awful Streets of our region. We’re too timid to do more, so it can have a ater impact on population density, pedestrian/transit rates, etc.

Bartholomew also thought St. Louis’ population in 1970 would increase to 900,000 — it had dropped to 622k. Fingers are crossed we don’t drop below 300k in 2020. If St. Louis wants to grow again the entire region needs to reject the many ways Bartholomew screwed up our region.

— Steve Patterson


Opinion: Our Gas Prices Are Way Too Low

October 4, 2017 Economy, Featured, Transportation Comments Off on Opinion: Our Gas Prices Are Way Too Low

Gasoline here in the U.S.is cheap compared to much of the world.

The average price of gasoline around the world is 4.09 U.S. Dollar per us gallon. However, there is substantial difference in these prices among countries. As a general rule, richer countries have higher prices while poorer countries and the countries that produce and export oil have significantly lower prices. One notable exception is the U.S. which is an economically advanced country but has low gas prices. The differences in prices across countries are due to the various taxes and subsidies for gasoline. All countries have access to the same petroleum prices of international markets but then decide to impose different taxes. As a result, the retail price of gasoline is different. (GlobalPetrolPrices)

Comparing gas prices alone doesn’t tell the full picture. For that I turned to a handy Bloomberg site,

Global gas prices are on the decline—about 2.3 percent, on average, in the past three months. Behind that modest decrease is a wide range of price swings felt differently around the world. We ranked 61 countries by three economic measures to see which has the most affordable gas and which feels the most pain at the pump.

It listed the US is the third most affordable — behind Venezuela and Saudi Arabia. Initially I decided to limit myself to the G7 countries:

Canada

Canada is seeking to restore its image as a leader on global warming with a nationwide tax on carbon pollution. The country has a lot to lose: Vast reserves of difficult-to-extract oil will mean either an environmental toll to produce it or an economic toll to keep in the ground. Cheap gasoline in Canada goes hand in hand with high consumption—only Americans use more per person.

France

The French can afford to pay for their expensive gasoline, but they’re increasingly turning to electric cars instead. French automakers Peugeot and Renault are both competing in the expanding market for EVs. France has one of the world’s highest EV sales rates and one of the densest charging networks.

Germany

German gas isn’t exactly cheap, but it’s little bother for the average driver in Europe’s largest economy. Gas consumption is average and is likely to decrease as the country commits to battery-powered cars. Incentives were introduced for car buyers in 2016, and BMW and Volkswagen are now working to electrify their fleets.

Italy

Car ownership in the home country of Ferrari and Maserati is among the highest in the world. However, the prolonged slump in global oil prices offered less relief to Italian drivers than in most countries, largely because of the country’s high taxes on fuel.

Japan

Japan’s long-standing national gasoline tax helped its carmakers take an early lead in developing fuel-efficient vehicles. Toyota and Honda invested big in fuel-cell technology, while the Nissan Leaf became the world’s best-selling electric vehicle. Japan now has more public battery chargers than gas stations.

United Kingdom

Sales of electric vehicles are accelerating in the U.K.—one of the biggest markets for battery-powered transportation. EVs make a lot of sense in a region defined by short driving distances and one of the highest gasoline prices in the world.

United States

President Donald Trump has scrapped environmental regulations and supported fossil-fuel production in the first months of his presidency. But if success is judged by the price of gasoline, there isn’t much room left for improvement. U.S. gasoline prices tumbled under his predecessor, Barack Obama, while oil production soared and cars became more efficient. Americans still guzzle more gas than any other country, so even with low prices, a thirst for the open road takes a bite out of the average paycheck.

I then decided I needed to also look at the country with the most expensive gas and the two where gasoline is more affordable than here:

Norway

Norway’s high gas prices and high incomes are an electric car maker’s dream. The country has the biggest share of electric vehicles in the world. That may seem strange for an economy built on oil, but Norway is one producer that doesn’t subsidize gasoline at the pump. Instead, the country uses its oil riches to fund national services, such as free college education and savings for infrastructure improvements.

Saudia Arabia

The Saudis sit atop two enormously valuable bodies of liquid: oil and water. Both are being pumped to the surface at unsustainable rates. Saudis rank among the greatest gas guzzlers in the world, but they devote a below-average share of their incomes to buying it. That’s because the government heavily subsidizes the price at the pump.

Venezuela

Life, liberty and the pursuit of happiness. Countries have different ideas as to which rights are inalienable, and Venezuela stands alone in considering nearly free gasoline a birthright. In 2016, President Nicolas Maduro raised pump prices 6,000 percent, but filling up a tank of gas still costs less than a cup of coffee. Venezuela isn’t a rich country but consumes gas like one.

I complied some of the information into a chart — looking at price per gallon, affordability relative to wages, gallons used per driver, and how each compares to the highest user of gasoline.
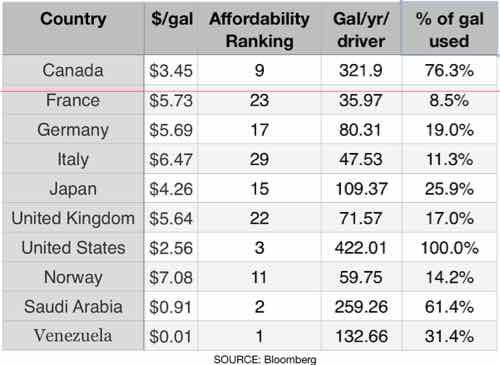
As you can see four other G7 countries (France, Germany, Italy, UK) have gas prices that are at least twice ours. Twice. We use far more gasoline than everyone else — even the two countries with more affordable gasoline.

The recent non-scientific Sunday Poll had fewer responses than usual:

Q: Current gas prices in St. Louis, at around $2.27/gal, are…

  • Extremely high 0 [0%]
  • High 1 [5%]
  • Somewhat high 1 [5%]
  • Neither low or high 7 [35%]
  • Somewhat low 4 [20%]
  • Low 3 [15%]
  • Extremely low 4 [20%]
  • Unsure/no opinion 0 [0%]

Still, more than half said our gas prices are on the low side of the scale. Decades of low taxes enabled us to build a non-sustainable auto-centric built environment. We can’t just raise taxes to where they should be, at least not too quickly. But we can’t continue to neglect our massive amount of crumbling infrastructure.

— Steve Patterson
 

Bus Stop Design In The St. Louis Region De-Prioritizes Transit

September 25, 2017 Featured, Planning & Design, Public Transit Comments Off on Bus Stop Design In The St. Louis Region De-Prioritizes Transit

Last month I posted about how St. Louis Does the Opposite of the National Association of City Transportation Officials (NACTO), this is the first example: bus stops.

Transit is returning to its central place in the life of cities. With more people using buses, streetcars, and light rail than ever before, our street design paradigm is shifting to give transit the space it deserves. People are choosing to live, work, and play in walkable neighborhoods, and cities are prioritizing highly productive modes like transit as the key to efficient, sustainable mobility for growing urban populations. Transit agencies and street departments are working together to create streets that not only keep buses and streetcars moving, but are great places to be. Cities are extending light rail systems, investing in streetcar lines, and creating new rapid bus lines at a stunning pace, with ridership growing even faster in city centers. Transit agencies are rethinking their networks to serve neighborhoods at a high level all day, not just at commute times, while bike share and active transportation networks make it even easier to not only reduce driving, but to avoid the expense of owning a car.  (NACTO: Transit Street Design Introduction) 

Some of NACTO’s principles:

On streets of every size and context, design can directly improve transit travel time, reliability, and capacity. Major projects like dedicated transitways can substantially increase transit speeds and the total person capacity of a street. On smaller streets, fine-grained improvements like bus bulbs and signal timing combine to transform the way the street works.  (NACTO: Transit Street Principles)

Transit streets are built around safe, low-stress, and complete pedestrian and bicycling infrastructure. Transit riders are active users of the street, relying on comfortable sidewalks and bikeways—and orderly motor vehicle traffic moving at safe speeds. Intuitive travel paths and frequent opportunities to cross the street make it easy and safe for people to get to transit stops, and are essential to building ridership.

Factors like presence of bicycle and pedestrian facilities, mixed land uses, and transit stop amenities have all shown significant positive correlations with transit ridership. However, the most significant indicator to ridership is transit level of service—transit frequency, transit alternatives, and route density—at a given stop location. (NACTO: Transit Street Principles)

On stops…

Use boarding islands and bulbs to allow transit vehicles to stop in their moving lane. Buses have long been expected to pull out of traffic to the curb, but this practice de-prioritizes transit, sometimes significantly on mixed-traffic streets. In-lane stops eliminate that delay, and provide an opportunity for near-level or level boarding. They also create shorter, safer pedestrian crossings, provide more walking space on the sidewalk, and make the street more predictable by sorting out bike-bus conflicts at stops. (NACTO: Transit Station & Stop Principles)

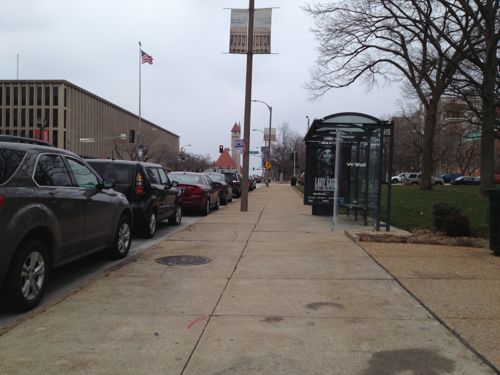
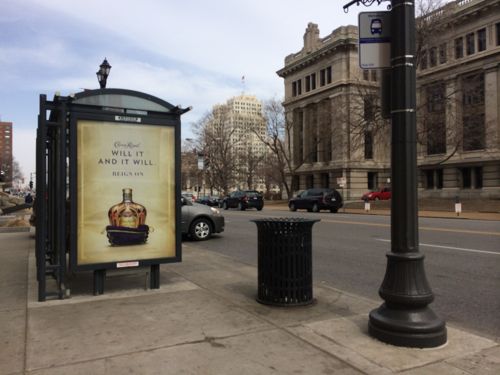
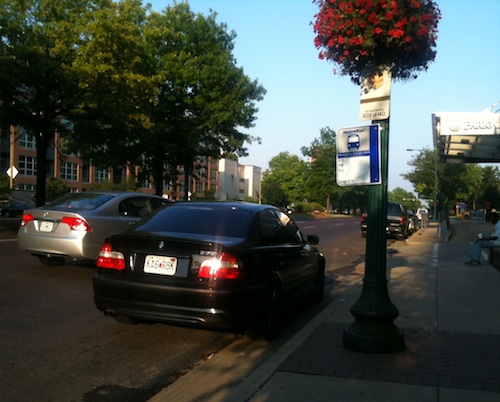
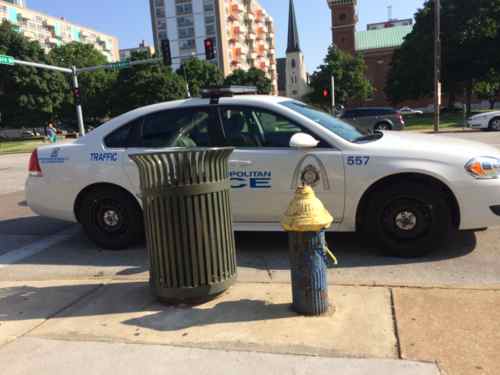
Sr. Louis, naturally, makes buses pull out of traffic rather than stay in the travel lane, as recommended. A problem I see often is people parking in the pull-out bus stop, from the archives:

MetroBus stop on the north side of Market Street filled with parked cars.
Cars on the north side of this 14th Street bus stop made it impossible for buses to pull up to the curb
Car parked in a bus stop on Forest Park
A St. Louis police car parked in front of a fire hydrant in a bus stop at 16th & Market.

More on the benefits of in-line stops:

By allowing buses to move in a straight line, in-lane stops eliminate both pull-out time and traffic re-entry time, a source of delay and unreliable service. In-lane stops are especially valuable on streets operating at or near vehicle capacity, or on streets with long signal cycles, in which transit vehicles may experience long re-entry delays while waiting for traffic to clear. (NACTO: Stop Placement & Intersection Configuration)

And the negatives of requiring buses to pull-out of the travel lane:

Where buses are required to pull from traffic to make stops, longer bus zones are needed to accommodate transitions to and from traffic.

Short transition distances add delay to transit service and require sharper transitions to the curb, wearing transit vehicles and infrastructure more quickly.

Enforcement is required to keep pull-out stops clear; vehicles standing or parking in the stop zone constrain the operator’s ability to pull completely to the platform.

Longer stops ease transitions into and out of stops, but require more curb length, reducing curbside parking spots.
At high-volume boarding locations, longer stops can be used to distribute queuing riders along the sidewalk and to ease pedestrian congestion.

The design of the humble bus stop can prioritize or de-prioritize transit. For decades the entree St. Louis region has de-prioritized transit use through the design of streets in the the public right-of-way.

— Steve Patterson


STL Downtown Multimodal Study Engagement Week Begins Today

September 18, 2017 Downtown, Events/Meetings, Featured, Transportation Comments Off on STL Downtown Multimodal Study Engagement Week Begins Today
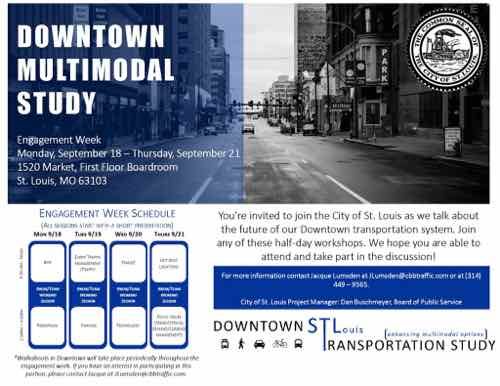
Click image to view larger version in Facebook

Today kicks off a week of events, from the Facebook Event page:

You’re invited to join the City of St. Louis as we talk about the future of our Downtown transportation system. Join any of these half-day workshops. We hope you are able to attend and take part in the discussion!

The week includes 8 half-day workshops scheduled around various topics. Please review the engagement week flyer pictured for more information about the schedule breakdown. Each workshop consists of different activities to gain feedback important to the study.

Walkabouts in Downtown will take place periodically throughout the engagement week. If you have an interest in participating in this portion, please contact Jacque at JLumsden@cbbtraffic.com.

For more information contact Jacqueline Ann (Jacque Lumsden) at JLumsden@cbbtraffic.com (CBB Transportation Engineers + Planners) or at (314) 449 – 9565.

City of St. Louis Project Manager: Dan Buschmeyer, Board of Public Service.

The schedule is as follows:

  • Monday 9/18
    • Morning: bike
    • Afternoon: pedestrian
    • Evening: general session
  • Tuesday 9/19
    • Morning: event traffic management/traffic
    • Afternoon:parking
  • Wednesday 9/20
    • Morning: transit
    • Afternoon: technology
  • Thursday 0/21
    • Morning: hot spot locations
    • Afternoon: policy issues (freight/travel demand/curbside issues)

All will take place in the 1st floor boardroom at 1520 Market. Foe more specifics see the Facebook Event page.

— Steve Patterson


Advertisement


[custom-facebook-feed]

Archives

Categories

Advertisement


Subscribe