Home » Politics/Policy » Recent Articles:

St. Louis Population May Drop Below 300K In 2020 Census

We’re at the midpoint between the 2010 & 2020 Census, in six years we’ll have the results of the 2020 Census. St. Louis’ population peaked in the 1950 Census — dropping in the following 6. Here’s a quick look:

jjj
The 70s was the decade of the greatest loss in terms of total numbers and percentage.

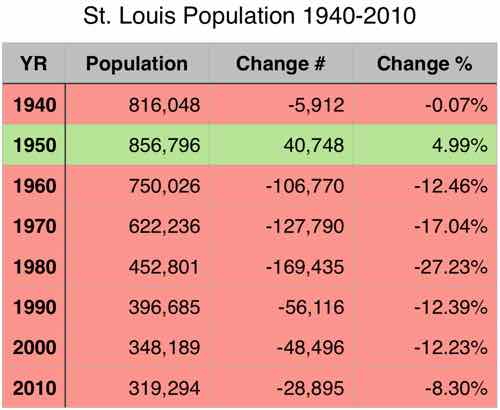
I think these figures are a reflection of what was happening in the city & region in each decade.  In the 50s you had the start of Urban Renewal Programs clearing out older neighborhoods, end of restrictive covenants/white flight, and initial highway construction in the city, in St. Louis County new subdivisions sprang up to accommodate the middle classes fleeing the city. This continued in the 60s & 70s. In the 80s & 90s it there wasn’t the big Urban Renewal or highways — decay was allowed to take hold in many areas. Now you began to see Black flight as middle class African-Americans left the city, largely for North County.

This continued in the 2000s but downtown and its perimeter areas we saw a boom in loft conversions and the addition of other new housing units in the central city. A result of the 2000s building boom, we saw the 2010 Census loss drop below 10%, as the city finally offered a little of the urban/walkable neighborhoods a segment of the general public desires. To be sure, most of the market likes suburbia.

Source: City of St. Louis
Four of our 28 wards showed an increase, the biggest drops came in North city wards. Source: City of St. Louis

For decades the city tried to remake itself into the suburban ideal — but this failed to appeal to those seeking suburbia as well as those seeking urban/walkable lifestyles.  Some, sadly, think the city should continue down the suburbanization path — even though we have decades of huge losses to show that strategy is a total failure. Just as urbanists aren’t drawn to places like New Town St. Charles, suburbanites aren’t drawn to our city version of suburbia. Both are compromises that attract a small segment.  The only strategy to limit losses in the city is urbanization.

The last 5 years we haven’t been doing much to add units in existing urban/walkable neighborhoods nor have we worked to turn more in the urban/walkable direction. This is why I think we’ll see another loss in 2020. If we lose another 28,895 people that would represent a 9% loss, and put us at 290,399. A loss of 19,294 would put us at 300,000 — this would be a 6% loss. I think our loss will be between 20,000-25,000.

North St. Louis County will see middle class blacks & whites leave in large numbers, but see an influx of lower income blacks from North city for newer housing. Of course this is all speculation at this point, the count will start in 5 years and we’ll know the results in 6.  Ward boundaries will be redrawn based on these numbers — down to 14 from 28 based on a charter change approved a few years ago. We still have five years to take action.

In the Sunday Poll more than half also think we’ll see a loss, while nearly 40% think we’ll see a gain.    Here are the results:

Q: St. Louis’ 2010 population was 8.3% less than 2000 — the smallest decline since the 1950 peak. What change will the 2020 Census reveal?

  1. Less than 5% LOSS 10 27.78%]
  2. Less than 1% GAIN 7 19.44%]
  3. Less than 10% LOSS 4 11.11%]
  4. TIE: 3 [8.33%]
    1. Less than 5% GAIN
    2. Greater than 10% LOSS
  5. TIE: 2 [5.56%]
    1. Less than 1% LOSS
    2. Less than 10% GAIN
    3. Greater than 10% GAIN
    4. Unchanged
  6. Unsure/No Answer 1 [2.78%]

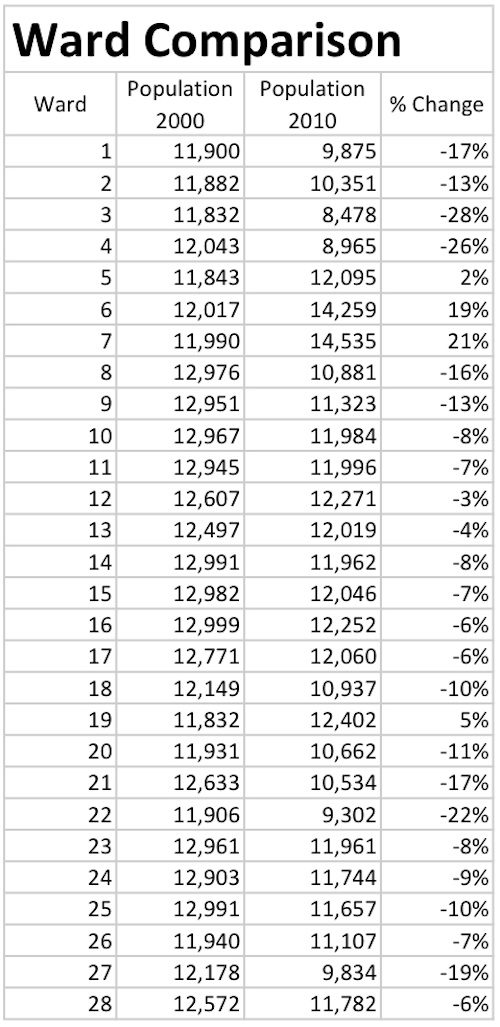
My curiosity is if the Wards/Census tracks that had gains in 2010 can hold onto those in 2020.

— Steve Patterson


Readers & Legislators on Daylight Saving Time

March 11, 2015 Politics/Policy 6 Comments

In the Sunday Poll nearly half of you felt Daylight Saving Time (DST) is no longer necessary, but more than half support it or are indifferent. In the news the next day:

Rep. Mike Kelley of Lamar is sponsoring a constitutional amendment that would ask voters whether Missouri should use daylight saving  time all the time. 

Under his measure, Missouri residents would switch to daylight saving time in March 2017 and never turn their clocks back again.  (Missouri House panel considers eliminating daylight saving time)

A voter-approved constitutional amendment? While I’m one of those who is indifferent to DST — I can see the pros & cons:

PROS:

  • Conserves Energy
  • Maximize Natural Daylight
  • Reduces Exposure to Artificial Lighting
  • Lighting Effect on Individual Performance
  • Prevents vitamin D Deficiency
  • Increases Sunlight Effect on Cardiovascular Illnesses
  • Reduces Light Pollution
  • Reduces Traffic Accidents
  • Reduces Rolling Blackout “Load Shedding”
  • Deters Criminal Activity
  • Increases Consumer Spending & Business Benefits
  • Extends Daylight Leisure Time
  • Extends Daylight for Outdoor Work
  • Increases Specifically Halloween “Candy” Sales
  • Benefits Indoor Ecosystems Benefits Travel & Tourism
  • Serves as a Reminder to Change Fire & Smoke Detector Batteries

CONS:

  • Energy Conserving Deemed a Myth
  • Effects Health & Healthcare Devices
  • Effects Psychology
  • Disturbs Sleep Pattern
  • Electronic Malfunctions
  • Criminal Effects on Vulnerable Population
  • Effects Financial Markets
  • Effects Personal & Professional Logistics
  • Effects Farmers’ Morning Productivity
  • Ineffective In Equatorial Regions
  • Increases Road Traffic
  • Effects Commuting Between Time Zones
  • Effects Television Networks
  • Timekeeping Challenges
  • Effective Only During Mass Observance
  • Observance Varies Between Regions
  • Ineffective Daylight Savings Researches & Studies

To read more on the above points click here. The following are the poll results:

Q: Is Daylight Saving Time Still Necessary?

  1. No, daylight saving time is no longer aiding energy conservation. 17 [48.57%]
  2. I’m indifferent. It’s only an hour’s difference. 14 [40%]
  3. Yes, because it’s engrained in our society. 4 [11.43%]

Hopefully in a week or two my brain will have adjusted to DST.

— Steve Patterson


Sunday Poll: Is Daylight Saving Time Still Necessary?

Please vote in the poll, located in the right sidebar

Today is the start of Daylight Saving Time (DST) — we Spring forward one hour:

Since the introduction of modern daylight saving time in the early 20th century, many countries have been adjusting the clock one hour ahead in spring and winding it back by one hour during fall.

This practice has been a controversial topic debated by both by the general public and politicians alike. (timeanddate.com)

Like many controversial practices, DST has pros & cons. Since we set our clocks ahead this morning, or last night before bed, I think this is a good topic for today’s poll. Rather than reinvent the wheel, I’ve copied a poll from AccuWeather: Is Daylight Saving Time Still Necessary?

The poll, located in the right sidebar, is open for 12 hours — closing at 8pm tonight — Central Standard Time (CST).

— Steve Patterson


Turnout In Tuesday’s Primary Varied Widely

ivotedLess than 10% of the city’s 181,967 registered voters actually voted in Tuesday’s partisan primary, but to get the bigger picture we need to delve deeper into the numbers. A total of  17,291 ballots were cast among the three parties selecting their candidates for the general election next month. As expected, the overwhelming majority selected a Democratic ballot:

  • Democrat: 16,520  — 96%
  • Republican: 651 — 4%
  • Green: 120 — 1%

The purpose of holding a partisan primary is so each party can select their candidate to compete in the general election, yet in St. Louis the Democratic primary is largely the entire election — win the Democratic primary and you’re basically the winner of the seat — the general is just a formality. Why do we continue to do this?

We’ll have three people running in the same ward — a Green, a Republican, and a Democrat. Each runs unopposed in the March primary only to face each other in the April general. We need to eliminate the March primary and just have a nonpartisan primary in April. It’ll save money, voters only need to go to the polls once, and each candidate will need to present themselves to voters to get elected.

In addition to eliminating the unnecessary primary, we need Ranked Choice/Instant Run-Off Voting:

 Ranked choice voting (RCV) describes voting systems that allow voters to rank candidates in order of preference, and then uses those rankings to elect candidates able to combine strong first choice support with the ability to earn second and third choice support. RCV is an “instant runoff” when electing one candidate and is a form of fair representation voting when used in multi-winner elections.

More on this later, back to the numbers from Tuesday’s election. Ok, so we know 9.5% of registered voters bothered to vote. Apathy, right? Wrong!

Aldermen were elected in 17 of 28 wards, those of us in the other 11 wards knew the only race for us to vote on was President of the Board of Aldermen — Lewis Reed would get the Democratic nomination over Jimmie Matthews, the Green & Republican candidates were challenged for their party nomination. Six of the 17 wards had unchallenged incumbents — no reason to vote. Only 11 of the city’s 28 wards had challengers. Apathy wasn’t responsible for the dismal turnout — it was our system that was set up when our population was growing and the two main parties fielded viable candidates in every race

  • In the six unchallenged wards the turnout ranged from a low of 4.5% (13th) to a high of 7.4% (6th) — an average of 6%
  • In the eleven contested wards the turnout ranged from a low of 8.7% (22nd) to 21.9% (8th) — an average of 15%

Clearly a contested election increases voter turnout!

The number of votes in a ward election is also telling:

  • The low was the uncontested 14th ward — only 242 of the 297 who voted selected the unchallenged incumbent — 55 voters (18.5%) knew their vote wouldn’t matter.
  • The high was the hotly contested 8th ward — 1,587 voted in the race — only 6 voters went to the polls but didn’t vote in the race for alderman.The winner, incumbent Stephen Conway, received 843 votes in the 2-way race — that’s more votes than in 9 .

The ranked voting mentioned above is important when you have three or more candidates.

  • In the 2nd ward none of the four candidates received more than 50% of the vote — only 5 votes separated the top two. Ranked voting may have selected a different winner.
  • In the 3-way race in the 7th ward Jack Coatar received over 50% of the votes — ranked voting wouldn’t have mattered because he received a plurality.
  • The 20th ward also had a 3-way race — Cara Spencer defeating 20-year incumbent Craig Schmid with 48% — not a plurality.
  • The only other 3-way race was the 22nd where incumbent Boyd received 77%!

When I went to bed Tuesday night the early returns had Ogilvie & Bauer tied 50/50.  In the end incumbent Ogilvie received 74.5% to win a second term.

In a related note here are the results of the Sunday Poll:

Q: Which of the following best describes your political views?

  1. Mostly liberal 18 [33.33%]
  2. Consistently liberal 16 [29.63%]
  3. Mixed 13 [24.07%]
  4. Mostly conservative 4 [7.41%]
  5. Consistently conservative 3 [5.56%]

Not really a surprise that self-described liberals made up nearly 63% of the responses, conservatives just 13%, with the balance (24%) in the middle.

Those with down-the-line conservative and liberal views do share some common ground; they are much more likely than others to closely follow government and political news. This carries over to their discussions of politics and government. Nearly four-in-ten consistent conservatives (39%) and 30% of consistent liberals tend to drive political discussions – that is, they talk about politics often, say others tend to turn to them for information rather than the reverse, and describe themselves as leaders rather than listeners in these kinds of conversations. Among those with mixed ideological views, just 12% play a similar role. (Pew: Political Polarization & Media Habits)

I’d like to see St. Louis eliminate the unnecessary primary and go to ranked choice voting at the same time we reduce the number of aldermen from 28 to 14 — after the results of the 2020 census are known in 2021. You can download my spreadsheet here (xlsx) and the election results here.

— Steve Patterson


Sunday Poll: Which of the following best describes your political views?

Please vote in the poll, located in the right sidebar
TPlease vote in the poll, located in the right sidebar

The question for today’s poll is pretty straightforward: Which of the following best describe you political views?

Here are the options, in alphabetical order:

  • Consistently conservative
  • Consistently liberal
  • Mixed
  • Mostly conservative
  • Mostly liberal

They’ll be in a random order in the poll — see top of right sidebar to make your selection.

— Steve Patterson


Advertisement


[custom-facebook-feed]

Archives

Categories

Advertisement


Subscribe