Home » Site Info » Recent Articles:

Poll: Should schools be forced to take students from unaccredited districts?

The poll this week is an exact duplicate of a poll run by the St. Louis Business Journal in June:

Should schools be forced to take students from unaccredited districts?

  • Yes, education is that important
  • No, it isn’t fair to taxpayers and students

I couldn’t come up with any better phrasing, so it’ll have to do.

STLSPJ
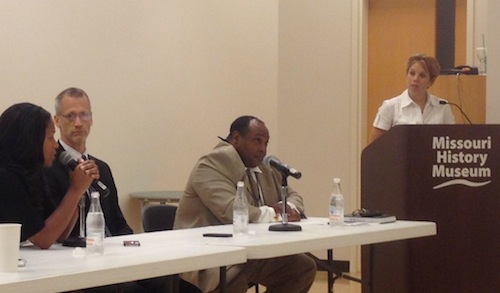
Left to right: Sharon Reed (KMOV), Eric Knost, Mehlville superintendent, Ty McNichols, Normandy superintendent, and moderator from St. Louis Chapter of the Society of Professional Journalists

Unaccredited schools are now paying overcrowded schools to accept transfer students. The transfer process was chaotic. Is this really the best we can do as a region?

The poll is in the right sidebar for a week.

— Steve Patterson


Poll Results on Vehicles Per Licensed Driver

There are many ways to measure and compare regions/states on how auto-centric they are. For the poll last week I selected number of vehicles per licensed driver. The results of the poll are near the end but first I want to share other data.

Ford Focus at the 2011 St. Louis Auto Show

Examples of vehicle miles traveled per capita in 2005:

  • 1) New York City metro: 5,889.9
  • 11) Chicago metro: 7,540.5
  • 22) Seattle metro: 8,552.6
  • 37) Wichita: 9,237.2
  • 46) Minneapolis metro: 9,585.0
  • 55) Austin metro: 10,220.3
  • 64) Kansas City metro: 10,726.2
  • 77) St. Louis metro: 11,511.4 
  • 88) Nashville metro: 12,275.4
  • 92) Oklahoma City metro: 12,325.0

I see this as good evidence our region is too auto dependent, 76 metro areas had less vehicles miles per person than we did in 2005! But maybe we’ve peaked:

When adjusted for population growth, the number of miles driven in the United States peaked in 2005 and dropped steadily thereafter, according to an analysis by Doug Short of Advisor Perspectives, an investment research company. As of April 2013, the number of miles driven per person was nearly 9 percent below the peak and equal to where the country was in January 1995. Part of the explanation certainly lies in the recession, because cash-strapped Americans could not afford new cars, and the unemployed weren’t going to work anyway. But by many measures the decrease in driving preceded the downturn and appears to be persisting now that recovery is under way. The next few years will be telling. (New York Times)

Even if we’ve declined since 2005 like everyone else, we’re still driving considerably more miles per capita than 76 other regions.

Here are the results from last week’s poll:

Q: How many vehicles per licensed driver in your household?

  1. One+, but less than two 33 [45.21%]
  2. Less than one, more than zero 21 [28.77%]
  3. Two+, but less than three 9 [12.33%]
  4. Zero 6 [8.22%]
  5. Three+ 4 [5.48%]

I’ll admit I broke an important rule when it comes to polls — keeping the answers uniform. It appears the readers who responded don’t have an excess of vehicles, with over 8% saying their household has zero cars per licensed driver.

— Steve Patterson


Poll: Have you, a family member, or friends, experienced at least a month of “Food Insecurity” in the last 5 years?

Food security/insecurity may be terms you’re not familiar with, this may help:

Food security refers to the availability of food and one’s access to it. A household is considered food-secure when its occupants do not live in hunger or fear of starvation. The USDA estimates that nearly 9 out of 10 U.S households were food secure throughout 2005. It is a measure of resilience to future disruption or unavailability of critical food supply due to various risk factors including droughts, shipping disruptions, fuel shortages, economic instability, wars, etc. Food security assessment is divided into the self-sufficiency rate (S) and external dependency rate (1-S) as this divides the largest set of risk factors. Although countries may desire a high self-sufficiency rate to avoid transport risks, this may be difficult to achieve especially for wealthy countries, generally due to higher regional production costs. Conversely, high self-sufficiency without economic means leaves countries vulnerable to production risks.

The World Health Organization defines three facets of food security: food availability, food access, and food use. Food availability is having available sufficient quantities of food on a consistent basis. Food access is having sufficient resources, both economic and physical, to obtain appropriate foods for a nutritious diet. Food use is the appropriate use based on knowledge of basic nutrition and care, as well as adequate water and sanitation. The FAO adds a fourth facet: the stability of the first three dimensions of food security over time. (Wikipedia)

Congress is currently debating cuts to the nation’s food stamp program — properly known as the Supplemental Nutrition Assistance Program (SNAP):

SNAP offers nutrition assistance to millions of eligible, low-income individuals and families and provides economic benefits to communities. SNAP is the largest program in the domestic hunger safety net. The Food and Nutrition Service works with State agencies, nutrition educators, and neighborhood and faith-based organizations to ensure that those eligible for nutrition assistance can make informed decisions about applying for the program and can access benefits. FNS also works with State partners and the retail community to improve program administration and ensure program integrity.

The poll this week asks if you, your family, or your friends, have had at least a month of food insecurity in the last 5 years. I’ll share my personal views on the topic, and share my own food insecurity experience, with the poll results on Wednesday, October 9th. The poll is in the right sidebar.

— Steve Patterson
 

Day Trips Are A Nice Getaway

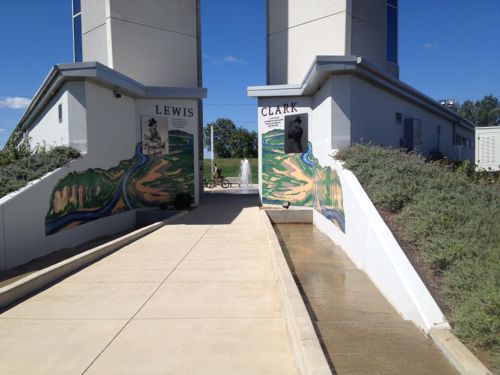
A week ago my boyfriend and I thought it was such a nice day, we should go do something.  We’d bought a Living Social voucher for two to see the Lewis and Clark Confluence Tower in Hartford IL, just a 30 minute drive north on Route 3.

This post is about the wonderful day trip that we ended up having through several counties in Illinois, two ferry rides, and returning to Missouri through St. Charles County.

As you approach the Lewis and Clark Confluence Tower
Cyclists on the trail on top of the levee
From the top level of the tower (150 feet high) you get a great view of the confluence of the Mississippi & Missouri rivers.
We didn't stop in Alton but we stopped just north to see the Piasa, click image for more info
We didn’t stop in Alton but we stopped just north to see the Piasa image on the limestone, click image for more info
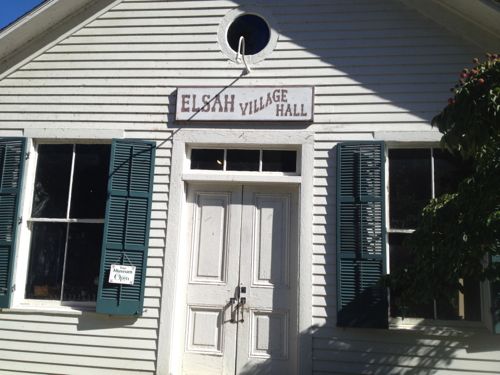
The Village of Elsah is one of my favorite stops along the River Road, click image for more info
The Village of Elsah is one of my favorite stops along the River Road, DFS liked it too!  Click image for more info
We took the scenic drive through Pere Marquette State Park, click image for more info
On the Golden Eagle Ferry from Calhoun Co IL to St. Charles Co MO

We both took many more pictures on our 5+ hour unplanned adventure. I say unplanned because I didn’t think beyond the Tower, we barely had enough cash on us for the mixed berry cobbler at The Cultured Table Bistro in Elsah plus the ferry into St. Charles Co, the Brussels Ferry is free.

We had a great day for very little money! We’re in Springfield IL this weekend, but later this fall I’m going to the DFS on a wine country tour through Augusta & Washington. What’s your favorite day trip from St. Louis?

— Steve Patterson


Poll: How Many Vehicles Per Licensed Driver In Your Household?

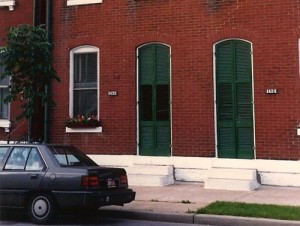
In the early 90s I lived in Old North and drove a late 80s Mitsubishi
In the early 90s I lived in a 3-room flat on Sullivan and drove a late 80s Mitsubishi

It has been nearly a year and a half since I sold my last car. In that time I’ve managed fine without a car, except for 2 times this year when I rented a vehicle to go out of town. Not having a car has got me thinking about cars I have owned over the 30 years I’ve been driving.

Growing up in suburban Oklahoma City our driveway could hold nine vehicles, with two more in the garage. Pretty consistently we had more than one vehicle per licensed driver.   Yes, not a typo — our driveway was 3×3.

I once owned three Volvos at one time, later I owned two Saabs concurrently. Now I don’t have a car, but my boyfriend does. Years ago my personal household had a peak of three vehicles per licensed driver, but now it is 0.5 vehicles per licensed driver. But for the most of the last 25 years on my own I’ve been one driver with one car.

For the poll question the week I’d like to know about the number of vehicles per licensed driver in your current household. The poll is in the right sidebar, I’ll post the results on Wednesday October 2nd.

— Steve Patterson


Advertisement


[custom-facebook-feed]

Archives

Categories

Advertisement


Subscribe