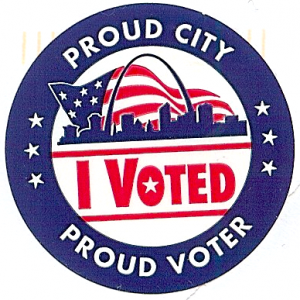
 Less than 10% of the city’s 181,967 registered voters actually voted in Tuesday’s partisan primary, but to get the bigger picture we need to delve deeper into the numbers. A total of 17,291 ballots were cast among the three parties selecting their candidates for the general election next month. As expected, the overwhelming majority selected a Democratic ballot:
- Democrat: 16,520 — 96%
- Republican: 651 — 4%
- Green: 120 — 1%
The purpose of holding a partisan primary is so each party can select their candidate to compete in the general election, yet in St. Louis the Democratic primary is largely the entire election — win the Democratic primary and you’re basically the winner of the seat — the general is just a formality. Why do we continue to do this?
We’ll have three people running in the same ward — a Green, a Republican, and a Democrat. Each runs unopposed in the March primary only to face each other in the April general. We need to eliminate the March primary and just have a nonpartisan primary in April. It’ll save money, voters only need to go to the polls once, and each candidate will need to present themselves to voters to get elected.
In addition to eliminating the unnecessary primary, we need Ranked Choice/Instant Run-Off Voting:
Ranked choice voting (RCV) describes voting systems that allow voters to rank candidates in order of preference, and then uses those rankings to elect candidates able to combine strong first choice support with the ability to earn second and third choice support. RCV is an “instant runoff” when electing one candidate and is a form of fair representation voting when used in multi-winner elections.
More on this later, back to the numbers from Tuesday’s election. Ok, so we know 9.5% of registered voters bothered to vote. Apathy, right? Wrong!
Aldermen were elected in 17 of 28 wards, those of us in the other 11 wards knew the only race for us to vote on was President of the Board of Aldermen — Lewis Reed would get the Democratic nomination over Jimmie Matthews, the Green & Republican candidates were challenged for their party nomination. Six of the 17 wards had unchallenged incumbents — no reason to vote. Only 11 of the city’s 28 wards had challengers. Apathy wasn’t responsible for the dismal turnout — it was our system that was set up when our population was growing and the two main parties fielded viable candidates in every race
- In the six unchallenged wards the turnout ranged from a low of 4.5% (13th) to a high of 7.4% (6th) — an average of 6%
- In the eleven contested wards the turnout ranged from a low of 8.7% (22nd) to 21.9% (8th) — an average of 15%
Clearly a contested election increases voter turnout!
The number of votes in a ward election is also telling:
- The low was the uncontested 14th ward — only 242 of the 297 who voted selected the unchallenged incumbent — 55 voters (18.5%) knew their vote wouldn’t matter.
- The high was the hotly contested 8th ward — 1,587 voted in the race — only 6 voters went to the polls but didn’t vote in the race for alderman.The winner, incumbent Stephen Conway, received 843 votes in the 2-way race — that’s more votes than in 9 .
The ranked voting mentioned above is important when you have three or more candidates.
- In the 2nd ward none of the four candidates received more than 50% of the vote — only 5 votes separated the top two. Ranked voting may have selected a different winner.
- In the 3-way race in the 7th ward Jack Coatar received over 50% of the votes — ranked voting wouldn’t have mattered because he received a plurality.
- The 20th ward also had a 3-way race — Cara Spencer defeating 20-year incumbent Craig Schmid with 48% — not a plurality.
- The only other 3-way race was the 22nd where incumbent Boyd received 77%!
When I went to bed Tuesday night the early returns had Ogilvie & Bauer tied 50/50. In the end incumbent Ogilvie received 74.5% to win a second term.
In a related note here are the results of the Sunday Poll:
Q: Which of the following best describes your political views?
- Mostly liberal 18 [33.33%]
- Consistently liberal 16 [29.63%]
- Mixed 13 [24.07%]
- Mostly conservative 4 [7.41%]
- Consistently conservative 3 [5.56%]
Not really a surprise that self-described liberals made up nearly 63% of the responses, conservatives just 13%, with the balance (24%) in the middle.
Those with down-the-line conservative and liberal views do share some common ground; they are much more likely than others to closely follow government and political news. This carries over to their discussions of politics and government. Nearly four-in-ten consistent conservatives (39%) and 30% of consistent liberals tend to drive political discussions – that is, they talk about politics often, say others tend to turn to them for information rather than the reverse, and describe themselves as leaders rather than listeners in these kinds of conversations. Among those with mixed ideological views, just 12% play a similar role. (Pew: Political Polarization & Media Habits)
I’d like to see St. Louis eliminate the unnecessary primary and go to ranked choice voting at the same time we reduce the number of aldermen from 28 to 14 — after the results of the 2020 census are known in 2021. You can download my spreadsheet here (xlsx) and the election results here.
— Steve Patterson


 Less than 10% of the city’s 181,967 registered voters actually voted in Tuesday’s partisan primary, but to get the bigger picture we need to delve deeper into the numbers. A total of 17,291 ballots were cast among the three parties selecting their candidates for the general election next month. As expected, the overwhelming majority selected a Democratic ballot: